Module 1 · Chapter 2 · Lesson
Repetition, Loops and Vectorised Thinking
Apply one verified method consistently across several plot records and prepare to reason about whole numerical collections.
Open this lesson in the Academy workspaceLearning pathway
You already know
Lesson 3 organised values into plot records. Lesson 4 turned one documented question into a tested decision path while preserving the original evidence.
In this lesson
You will apply one method to a defined sequence of records, expose the changing loop state and account for how many records were received, used, missing and flagged.
Why this comes now
A rule applied manually to six records can drift between copies. Iteration makes the method consistent, but scientific comparability, inclusion policy and the summary denominator still require deliberate choices.
You will use this later
Lesson 6 packages repeated logic into functions. Lesson 7 checks a loop result against a NumPy operation, Lesson 10 replaces manual aggregation with pandas, and Module 2 repeats auditable work over geometries, raster windows and files.
1. Apply one transparent method to several plots
Learning outcome
By the end of this lesson, you will be able to use a for loop to apply the same documented operation to several vegetation records, trace the loop one iteration at a time, and calculate a simple summary without copying code. You will also recognise when later array-based tools can replace a manual loop.
Prerequisites: Complete Lessons 1–4. You should be able to use lists, dictionaries, comparisons and if statements. Allow 75–90 minutes.
Why this matters
A remote sensing scene may contain millions of pixels; a field campaign may contain hundreds of plots. Copying the same instruction for every observation is slow and creates opportunities for inconsistent edits. Repetition should be expressed once and applied systematically.
Loops are valuable even when a library could perform the final calculation more efficiently. A loop exposes the logic: select a record, apply the rule, update a result, continue. Understanding that sequence makes later NumPy and pandas operations easier to trust and debug.
Scientific context
You will work with the first three published Saardu records: SALS1, SALS2 and SALS3, whose Sp_richness values are 7, 6 and 5. The example is deliberately small enough to check by hand. This is a verification habit, not a toy exercise.
Core idea: a loop repeats the same method for each item in a collection; the method stays constant even though the current item changes.
Learner action
Add ## Lesson 5 — Repetition and loops to your notebook. Under it, describe one repeated step from an ecological survey or GIS workflow and one risk created by performing it manually.
2. Read a for loop as a scientific sentence
plot_ids = ["SALS1", "SALS2", "SALS3"]

for plot_id in plot_ids:
    print("Reviewing", plot_id)
Read the loop aloud: “For each plot_id in plot_ids, print a review message.” Python takes the first item, runs the indented block, returns for the second item, and stops only after the collection is exhausted.
The name plot_id is a temporary loop variable. It refers to a different list item during each iteration. The original list remains available after the loop.
Output follows the list order, but that order is not automatically temporal, spatial or ecologically meaningful. Interpret sequence only when its provenance establishes what the order represents.
Predict before running
Predict how many output lines will appear and which identifier appears on the second line. Then run the cell and compare the actual order with the list order.
Code walkthrough
- The list contains three strings in a meaningful sequence.
forstarts the repetition instruction.plot_idnames the current item.in plot_idsidentifies the collection to traverse.- The colon opens the loop block.
- Four spaces indent the instruction repeated for every item.
3. Keep each record together while you iterate
A list of dictionaries preserves both sequence and named fields. Each iteration can therefore process one coherent plot record rather than several disconnected lists.
Specify the batch before processing it
| Batch decision | Lesson example | Why it matters |
|---|---|---|
| analysis population | SALS1–SALS3 only | defines the scope of every output claim |
| field and meaning | published Sp_richness count | prevents unlike variables from being combined |
| inclusion rule | all three records; no missing values | defines which evidence reaches the denominator |
| repeated operation | add one richness value to the running total | keeps the method constant across records |
| outputs | trace, total, count and mean | makes state and denominator inspectable |
| verification | hand result (7 + 6 + 5) / 3 | supplies an independent known answer |
This is a small batch-processing contract. The same decisions remain necessary when the batch contains 120 rows or thousands of raster tiles.
Worked example
Type the example, but calculate the expected total and mean by hand before running it:
plots = [
    {"SampleID": "SALS1", "Sp_richness": 7},
    {"SampleID": "SALS2", "Sp_richness": 6},
    {"SampleID": "SALS3", "Sp_richness": 5},
]

richness_total = 0
for plot in plots:
    richness = plot["Sp_richness"]
    richness_total = richness_total + richness
    print(plot["SampleID"], richness, richness_total)

mean_richness = richness_total / len(plots)
print("Mean richness:", mean_richness)
The expected output is:
SALS1 7 7
SALS2 6 13
SALS3 5 18
Mean richness: 6.0
Code walkthrough
plotscontains three related records in published order.richness_total = 0creates an accumulator before the loop. Zero is an appropriate starting value for addition; it is not a missing measurement here.for plot in plots:assigns one dictionary at a time toplot.- Dictionary access retrieves the current richness value.
richness_total = richness_total + richnessreplaces the running total with its previous value plus the current value.- The first
printexposes the loop state. This trace is useful while learning and debugging. len(plots)returns the number of records.- The mean is calculated after the loop, once the total is complete.
The denominator len(plots) is defensible here only because all three richness values are present and included. In real data, the number of records received and the number of values used may differ. Always report the denominator that actually supports the calculation.
4. Separate iteration from scientific interpretation
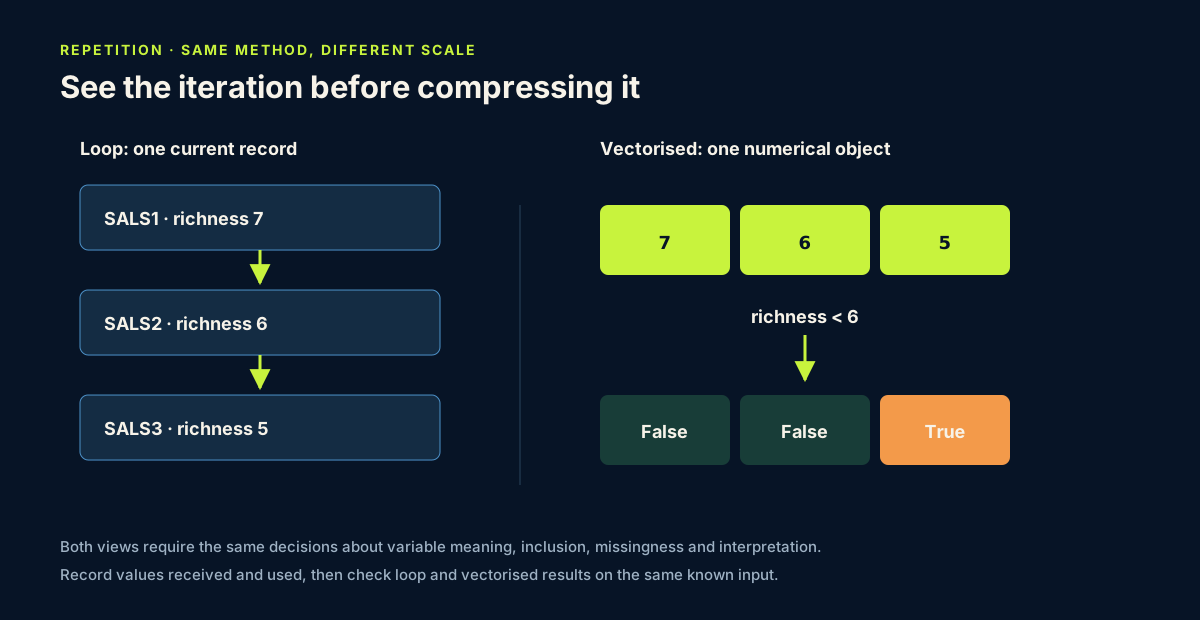
The loop answers a computational question: how can the same addition be applied to every current record? The resulting mean answers a descriptive question for these three plots only. It does not establish a regional pattern or a causal explanation.
The calculated value is easy to verify manually: (7 + 6 + 5) / 3 = 6. Use small known examples to test logic before scaling up. If code disagrees with the hand calculation, investigate before adding more data.
A trace is temporary diagnostic output; a professional audit summary records the final counts and decisions without overwhelming the reader with every iteration. Keep detailed traces while debugging, then retain the evidence needed to reproduce the conclusion.
5. From loops to vectorised thinking
Vectorised thinking means identifying the complete set of comparable values and expressing one operation over that set. In Lesson 7, a NumPy array will allow you to write a mean operation directly on the richness values. In Lesson 10, pandas will group many rows and summarise each group.
This does not make loops obsolete:
- loops are clear for record-specific actions, file-by-file processing and custom reporting;
- vectorised operations are usually clearer and faster for numerical transformations across a whole array or table column;
- both require the same scientific decisions about inclusion, units, missingness and interpretation.
Choose the expression that makes the method easiest to verify. Speed is not the only criterion.
When a loop is later replaced with NumPy or pandas, run both versions on the same small known input and compare the results. This equivalence check tests whether the compressed method preserved the intended calculation; it does not prove that the scientific population or variable choice was valid.
6. Common mistakes and recovery
Placing the accumulator inside the loop
Recognition: the total resets for every plot and the final value equals only the last richness. Fix: create the accumulator once, before the loop.
Forgetting indentation
Recognition: Python reports an indentation error, or only part of the intended method repeats. Fix: align all instructions that belong to the loop with four spaces.
Overwriting instead of accumulating
Recognition: richness_total = richness discards the previous total. Fix: include the previous accumulator value in the update.
Dividing inside the loop
Recognition: several partial means are produced, or the accumulator is changed before all records are counted. Fix: finish collecting the total, then calculate the mean after the loop.
Iterating over the wrong object
Recognition: looping directly over a dictionary produces its keys, such as SampleID, rather than complete records. Fix: inspect the structure and say aloud what one iteration should represent.
Ignoring missing values
Recognition: addition fails when a value is None, or missingness is silently replaced by zero. Fix: define and document a missing-value policy before calculating. Lesson 9 will apply this systematically to the full table.
7. Guided practice — trace a new sequence
Use published plots SALS4, SALS5 and SALS6, whose Sp_richness values are 7, 7 and 3.
- Create a list of three dictionaries.
- Predict the running total after each iteration.
- Use a loop to print plot ID, current richness and running total.
- Calculate the mean after the loop.
- Verify the result by hand.
- Add a condition inside the loop that prints
reviewwhen richness is below the instructional threshold 6 andretainotherwise. - In Markdown, explain why the loop makes the rule consistent but does not validate the threshold.
Data-completeness extension
Create a separate instructional copy of the three records and replace one richness value with None. Do not change the published-value example. Write a second loop that:
- counts every record received;
- adds to the richness total and
values_usedonly when richness is present; - counts missing values separately;
- calculates a mean only when
values_usedis greater than zero; - prints all three counts beside the mean.
Verify by hand that the denominator is values_used, not the number of records received. Explain why replacing the missing value with zero would answer a different question.
Run the complete notebook from the beginning. Confirm that the new loop uses data created in its own section and does not depend on a hidden cell execution order.
8. Independent challenge, reflection and portfolio artifact
Create records for SALS1 through SALS6 using their published Sp_richness values: 7, 6, 5, 7, 7 and 3.
- Count how many plots fall below the instructional threshold 6.
- Track their IDs in a list named
review_ids. - Calculate the mean richness for all six plots.
- Print a concise audit summary containing records received, richness values used, missing values, below-threshold count, review IDs, total and mean.
- Predict all final values before running.
Professional QA decision
Classify the batch result as:
ready for handoverwhen population, field, policy, denominator, trace and hand verification agree;reviewwhen any count or result differs from the prediction;stopwhen a missing-value or inclusion policy is absent, or when records are not scientifically comparable.
State whether list order carries scientific meaning and whether the instructional threshold is suitable only for demonstrating code. A correct mean without this context is incomplete evidence.
Scientific interpretation
The count tells you how many of these six records meet a programming rule. The mean describes only this selected sequence. Neither result explains the ecological processes behind species richness, and neither should be generalised to all four study sites.
Answer in your private notes:
- What changes during each iteration, and what stays constant?
- Why must an accumulator be created before the loop?
- When would a loop communicate a method more clearly than a vectorised expression?
- What missing-value decision would be required before adding biomass values?
- Why should a report show both records received and values used?
Submission
- Notebook: the continuing notebook with the worked example, trace output, guided practice and independent six-plot challenge.
- Screenshot: the final audit summary and the code that produced it.
- Written answer: 180–250 words explaining iteration, accumulation, denominator choice, verification by hand and the limits of the resulting mean.
Portfolio artifact
Artifact 05 — Repeatable plot-processing workflow
This fifth checkpoint in Portfolio Project 1 — Vegetation Data Explorer demonstrates that you can apply one documented method consistently across several ecological records, account for missing and included evidence, and verify the result before scaling up.