Module 2 · Chapter 4 · Professional Practicum
UAV Product QA and Error Diagnosis
Integrate mission, image, photogrammetry, georeferencing, mosaic, surface, multispectral and temporal evidence.
Open this lesson in the Academy workspace1. Quality is conditional on the intended analysis
Learning outcome
By the end of this lesson, you will be able to perform a structured UAV audit across mission, image, reconstruction, georeferencing, orthomosaic, DSM, multispectral and temporal categories; connect each finding to scientific consequence and corrective action; and classify products as acceptable, review or unsuitable for a stated use.
- Lesson type: Professional practicum
- Estimated time: 130–150 minutes
- Prerequisites: Lessons 2.18–2.23 and Chapter 3 raster QA.
Why this matters
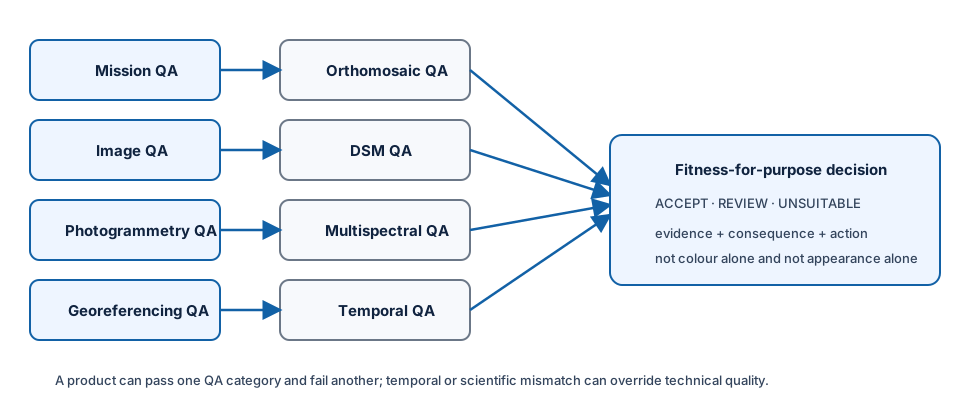
No single diagnostic proves UAV product quality. A product can pass geometric QA while failing radiometric comparability. It can have low internal reprojection error while failing independent position. It can be technically excellent and still mismatch the field campaign in space or time.
A professional audit makes these dimensions visible and produces an actionable decision. It does not hide difficult regions behind a global pass.
Scientific context
The synthetic handover has deliberate problems: changing illumination, one blurred frame, weak south-east georeferencing, a band shift, an orthomosaic seam, DSM spike and pit, temporal mismatch, inconsistent NoData and ambiguous Red Edge scale. Some products remain usable for limited purposes; others must stop before analysis.
Mental model
Learner action
Create 07_uav_product_validation.ipynb and UAV_QA_MATRIX.csv. Use these columns:
category,test,expected,observed,status,severity,scientific_consequence,action,evidence,owner
Use text status plus consequence; never make colour the only signal.
2. Mission QA asks whether the required observations exist
Audit:
- intended and achieved coverage;
- forward and side overlap;
- missing images or flight lines;
- height above ground and terrain effects;
- speed, trigger interval and shutter type;
- start/end time and duration;
- weather, wind and illumination transitions;
- control/check design;
- permissions, safety and data governance evidence.
The plan is not the achieved mission. Captured image centres, timestamps, aligned images and processing coverage reveal what occurred. One unaligned image may be harmless redundancy or a critical gap depending on location.
For the synthetic fixture, calculate nominal GSD and spacings, then compare the 32-minute observation interval with illumination notes and image metadata. Classify the mission separately for geometry and radiometry.
3. Image QA protects the reconstruction inputs
Inspect source images or compact metadata for:
- blur and motion direction;
- overexposure, saturation and underexposure;
- exposure or gain changes;
- shadows and cloud transitions;
- missing/corrupt files;
- geotag and time completeness;
- panel and irradiance records;
- rolling-shutter risk;
- moving vegetation or water.
Summaries should be spatial and temporal. A 1% mission-wide saturated fraction could be concentrated in all target plots. One blurred edge image could remove redundancy where the block is already weak.
The fixture’s IMG_0007 and IMG_0010 are review cases for different reasons. Keep their evidence separate.
4. Photogrammetry QA diagnoses model strength
Review:
- images aligned versus total;
- connected components and camera network;
- feature/match and tie-point distribution;
- reprojection residual distribution;
- estimated camera-parameter stability;
- control residuals and weights;
- weak edges and gaps;
- dense-cloud confidence, filtering and holes;
- surface interpolation and smoothing.
Do not promote internal diagnostics into external claims. The 0.42-pixel reprojection error says the fitted image model is internally consistent under its statistic. It does not overrule south-east check-point error.
Interpretation task
Write one QA-matrix row for the unaligned image and another for reprojection error. Give them different expected evidence and consequences.
5. Georeferencing QA is independent and spatial
Use control residuals for fitting diagnosis and withheld check points for external assessment. Report:
- survey reference and uncertainty;
- point roles and distribution;
- east, north and vertical bias;
- component and planimetric RMSE;
- maximum residual and point ID;
- residual-vector map;
- local warping and edge behaviour;
- horizontal and vertical use decisions.
The synthetic south-east point should create a regional warning even if the global average remains moderate. For plot overlay, ask whether any target polygon lies in the weak zone and whether uncertainty is small enough relative to plot support and boundary gradients.
6. Orthomosaic QA separates appearance from measurement
Inspect:
- output CRS, transform, GSD, dimensions and NoData;
- seamlines and contribution changes;
- ghosting or doubled edges;
- displacement near tall objects;
- blurred patches and texture discontinuity;
- colour balancing and radiometric changes;
- weak block edges and holes;
- resampling and oversampling;
- source-image and time provenance.
Use a fixed display stretch when comparing regions. An adaptive stretch can hide brightness differences. Visual seams must be linked to numeric values and analytical support.
uav_rgb_preview.tif is explicitly an 8-bit display preview. Its seam matters for visual-product integrity, but it cannot be used to infer calibrated reflectance. If a seam crosses a field polygon, document it even if the planned analysis uses another band stack.
7. DSM QA uses geometry and scientific plausibility
Inspect:
- vertical units and datum;
- grid and surface meaning;
- spikes, pits and isolated extremes;
- holes and interpolation;
- vegetation noise and smoothing;
- water behaviour;
- edge effects;
- comparison with independent elevations;
- alignment with other surfaces.
Automated range or local-neighbourhood tests are useful, but thresholds must reflect expected landscape and purpose. An 18.5 m value is implausible in this controlled 2–4 m synthetic surface; in a forest or building scene it could be valid.
Never repair the source in place. Create a documented derivative only after identifying cause and choosing a defensible correction or mask.
8. Multispectral QA must precede indices
For each band, verify:
- band identity and documented spectral response;
- stored quantity, scale and units;
- exposure/calibration and valid range;
- CRS, transform, resolution, shape and bounds;
- NoData and masks;
- co-registration globally and around edges;
- saturation, shadow and illumination consistency;
- contribution time and temporal compatibility.
The shifted NIR must fail alignment. The Red Edge scale must remain under review. A mathematically valid NDVI from shifted pixels or unverified scales is not a scientifically valid index.
9. Temporal QA can override technical quality
Record:
- field survey date and time;
- UAV acquisition range;
- tide or water level;
- wind and vegetation motion;
- mowing, grazing or disturbance;
- phenological state;
- rainfall, temperature or thermal context;
- source-image time contribution by region.
The four-day mismatch in the fixture is not automatically unacceptable. If no disturbance occurred and vegetation state was stable, it may be defensible for some variables. Tidal inundation, grazing or rapid flowering could make it unsuitable. The decision needs external context, not only file metadata.
10. Severity and status answer different questions
Use status:
- pass — the declared expectation is met for the intended use;
- review — evidence is incomplete or a condition needs bounded investigation;
- fail — a predeclared requirement is not met.
Use severity to describe consequence, for example minor, major or blocking. A failed cosmetic seam test may be minor for numeric DSM analysis. A review for unknown reflectance scale is blocking for quantitative spectral analysis.
The product decision can be:
- acceptable for a stated use;
- review pending evidence or bounded correction;
- unsuitable for that use.
Avoid one global “good data” label. State product, area, variable and use.
Worked example — create an actionable QA row
Predict before running
Will a shifted NIR band be labelled review or fail for immediate NDVI calculation?
finding = {
    "category": "multispectral",
    "test": "NIR grid matches Red grid",
    "expected": "identical CRS, transform, shape and bounds",
    "observed": "origin shifted 0.1 m east and north",
    "status": "fail",
    "severity": "blocking",
    "scientific_consequence": "NDVI combines different footprints",
    "action": "register and independently validate before calculation",
}

for field, value in finding.items():
    print(field, value, sep=": ")
Code walkthrough
- Category locates the finding within the QA chain.
- Test names one falsifiable requirement.
- Expected defines the grid contract.
- Observed reports the measured shift.
failrecords that the current product does not meet the test.blockinglinks the failure to immediate cell-wise calculation.- Scientific consequence explains false spatial mixing.
- Action describes the evidence required to proceed.
- The raw shifted file remains preserved.
11. A QA map is evidence, not decoration
Create a map that locates:
- check-point residual vectors;
- weak reconstruction region;
- orthomosaic seam/ghosting;
- DSM spike and pit;
- shifted-band edge diagnostic;
- field plots and study boundary;
- areas excluded or under review.
Include source, CRS, scale, symbology meaning, date and a text alternative. Use patterns or labels in addition to colour. The map should help a reviewer connect findings to target support.
QGIS visual QA companion
QGIS is ideal for blinking bands, inspecting seam and artefact locations, comparing DSM hillshade and overlaying plots. Record project CRS, layer sources and styling. Python remains the reproducible source of residual, alignment, range and checksum calculations.
12. Common mistakes and recovery
One global quality score
Why: dashboards prefer simplicity. Detect: geometry, radiometry and timing collapse into one number. Recover: maintain category-specific evidence and use-specific decisions.
Visual appearance is the only test
Why: maps are intuitive. Detect: no residual, mask or alignment assertions. Recover: combine QGIS diagnosis with reproducible quantitative checks.
Hiding bad areas
Why: final maps look cleaner. Detect: gaps appear without decision records. Recover: map exclusions, preserve original support and state consequence.
Treating review as pass
Why: analysis deadlines. Detect: unresolved scale or datum enters computation. Recover: make blocking review conditions executable stop checks.
Applying a universal threshold
Why: it feels objective. Detect: threshold lacks target, units or reference. Recover: justify criteria from product definition and intended use.
13. Guided practice — complete the UAV QA matrix
- Verify every file checksum against
manifest.json. - Add mission geometry, duration, illumination and temporal rows.
- Add image blur, saturation and exposure-change rows.
- Add alignment fraction, reprojection and calibration-stability rows.
- Add separate GCP and check-point rows.
- Calculate bias, RMSE and maximum; map the south-east residual.
- Add RGB seam and ghosting rows.
- Add DSM spike/pit and vertical-reference rows.
- Add band alignment, NoData and Red Edge scale rows.
- Link every finding to affected product and support.
- Assign status, severity, consequence, action and owner.
- Produce at least one acceptable, one review and one unsuitable decision.
- Export
UAV_QA_MATRIX.csv, reopen it and verify row/column counts. - Create the QA map with a text description.
QA checklist
- All eight QA categories are represented.
- Expected and observed evidence are separate.
- Control, check and reprojection evidence are not conflated.
- Geometric, radiometric and temporal decisions remain independent.
- Every status includes consequence and action.
- Findings are spatially connected to target support.
- Colour is not the only status cue.
- Raw inputs remain unchanged.
14. Independent challenge — accept different products differently
Prepare use-specific decisions for:
- RGB map used only for field orientation;
- DSM used to describe broad upper-surface variation;
- Red and NIR used for plot NDVI;
- Red Edge used in a quantitative index;
- south-east plots used for boundary-level extraction.
For each, cite evidence, unresolved uncertainty, acceptable region, stop condition and next action. It is correct for one handover to produce different decisions.
Scientific interpretation
UAV QA is a connected argument: observation requirements lead to tests; tests produce evidence; evidence is interpreted through consequences; consequences lead to decisions and actions. Passing one category never silently compensates for failing another.
15. Reflection, submission and portfolio artifact
Answer in your private notes:
- How can geometry pass while radiometry fails?
- Why can internal QA pass while absolute position fails?
- Which temporal conditions can invalidate an otherwise strong product?
- What makes a QA finding actionable?
- Why should decisions be product- and use-specific?
Submission
- Notebook:
07_uav_product_validation.ipynbwith reproducible checks. - Matrix:
UAV_QA_MATRIX.csv. - Map: labelled error and review areas.
- Written answer: 350–450 words summarising use-specific decisions.
Portfolio artifact
Artifact 2.24 — UAV QA matrix and error map
Add the matrix, map and decision summary to the Professional UAV Product Audit and Processing Report.