Module 1 · Chapter 4 · Lesson
Vegetation Data Explorer Project
Assemble the complete notebook into a reproducible claim–evidence chain and deliver a defensible ecological briefing.
Open this lesson in the Academy workspaceLearning pathway
You already know
Lessons 1–11 created one continuous chain: reproducible notebook, honest values, auditable records, decision rules, batch processing, tested functions, arrays, published-file intake, data quality, descriptive summaries and accessible figures.
In this lesson
You will remove duplication, connect every claim to its source and processing evidence, export an inventoried handover package and ask an independent reader to reproduce and challenge the result.
Why this comes now
A portfolio artifact is credible only when the separate lesson checkpoints operate as one method. Synthesis reveals hidden state, inconsistent assumptions and unsupported claims that isolated cells may conceal.
You will use this later
Module 2 reuses the handover pattern for geospatial and UAV evidence. Module 1 provides foundations for all three graduate profiles; it does not yet demonstrate spatial engineering, operational EO analysis or remote-sensing research competence by itself.
1. Assemble a reproducible scientific argument
Learning outcome
By the end of this lesson, you will be able to organise the complete Vegetation_Data_Explorer.ipynb as a reproducible claim–evidence chain, run it from a clean kernel, export its key outputs and defend one cautious ecological finding. You will submit the finished Module 1 portfolio project.
Prerequisites: Complete Lessons 1–11 in the same notebook. Allow 3–5 hours over more than one session. This is a synthesis project; it introduces no major new Python syntax.
Why this matters
Employers, collaborators and reviewers need more than isolated code cells. They need to see how a scientific question led to a documented data source, quality decisions, an analysis population, reproducible calculations, clear figures and appropriately limited conclusions.
A polished notebook is not one that hides every complication. It is one that lets another scientist understand what was done, reproduce the outputs, challenge the assumptions and identify what evidence would be needed next.
Scientific context
You are preparing an internal research briefing for the Baltic coastal meadow group. The published field table may later support comparison with UAV or satellite observations, but Module 1 does not yet establish a remote-sensing model. Your task is to create a trustworthy field-data explorer that a geospatial colleague could use as a documented starting point.
Core idea: a professional notebook connects question, source, method, result and limitation so that each claim can be traced back to evidence.
Learner action
Duplicate your notebook as a safety copy. Continue working in Vegetation_Data_Explorer.ipynb; do not combine results by copying screenshots from separate notebooks.
Define four completion gates
| Gate | Required evidence | A failure means |
|---|---|---|
| data | DOI, licence, immutable filename, checksum, parser and structural audit | source identity or intake is unresolved |
| computation | explicit population, tested functions, reconciliation checks and clean Run All | result cannot be reproduced reliably |
| science | question, variable meaning, denominators, quality decisions and limitations | execution cannot support the claim |
| communication | standalone tables, captions, text alternatives and output inventory | another reader cannot evaluate the evidence |
The project is complete only when all four gates pass. Visual polish cannot compensate for a failed data or scientific gate.
2. Choose one focused investigation
Select one pathway:
Path A — species richness and sampling structure
Question: How does observed plot-level species richness vary among sampled sites and plant-community codes?
This path has complete Sp_richness coverage but requires caution because sites have unequal row counts and community codes are not balanced across all sites.
Path B — biomass availability and observed values
Question: How does above-ground biomass availability and the distribution of recorded AGB values differ among sampled sites?
This path makes missingness central: 59 of 120 AGB values are absent, so availability and observed values must be reported separately.
Path C — plant-trait exploration
Question: How does one selected trait field—such as CCI_CWM, LA_CWM or Height_median—vary across the sampled site and community structure?
This path requires a metadata caution: do not assert a unit or expanded code meaning that the supplied record does not document.
Rewrite the chosen question in your own words. Keep it descriptive. Do not claim that site or community causes the observed pattern.
3. Use a professional notebook architecture
Organise the notebook in this order:
- Title and executive summary — question, dataset and two-sentence result.
- Scientific context — why the variable could matter for future Earth Observation work.
- Data provenance — title, creators, DOI, licence, filename and download date.
- Environment and imports — Python and library versions.
- Load and structural audit — path, shape, identifiers, fields and parsing choices.
- Data dictionary — exact fields, roles, dtypes, missingness and metadata cautions.
- Quality decisions — checks, triggered rows, missing-value policy and audit log.
- Analysis population — explicit filters, row counts and group coverage.
- Reusable methods — at least one tested function.
- Results — descriptive tables, one validated join or reshape and two figures.
- Scientific interpretation — finding, uncertainty, limitations and next evidence.
- Reproducibility check — restart, Run All, output export and final checklist.
Add an evidence map after the executive summary. For each major claim, list its source fields, analysis population, quality decision, method or function, table/figure and limitation. This gives a reviewer a direct route from wording back to evidence.
Use numbered headings and short paragraphs. Keep code close to the narrative that explains its purpose and output.
4. Build an analysis checkpoint with explicit guarantees
Worked example
The function below is a pattern, not a complete project. Predict which assertion would fail if sample identifiers were duplicated:
def build_richness_summary(data):
    required = {"SampleID", "site", "Sp_richness"}
    missing_columns = required - set(data.columns)
    if missing_columns:
        raise ValueError(f"Missing columns: {sorted(missing_columns)}")
    if data["SampleID"].duplicated().any():
        raise ValueError("SampleID must be unique")
    analysis = data.loc[
        data["Sp_richness"].notna(),
        ["SampleID", "site", "Sp_richness"],
    ].copy()
    summary = analysis.groupby("site", observed=True).agg(
        n=("SampleID", "nunique"),
        mean=("Sp_richness", "mean"),
        median=("Sp_richness", "median"),
        sd=("Sp_richness", "std"),
    )
    return analysis, summary
richness_analysis, richness_summary = build_richness_summary(meadows)
print(richness_summary.round(2))
Code walkthrough
- The function accepts a table through a parameter rather than depending on a hidden global source.
- A set comparison checks that required columns are present.
raise ValueErrorstops the method with a specific message when a requirement is not met.- Identifier uniqueness is checked before grouping.
- The analysis population is explicit and copied.
- The group summary retains count, centre and spread.
- Returning both the selected rows and summary preserves evidence behind the output.
- Display rounding occurs after the full-precision calculation.
Adapt the pattern to your chosen pathway. Test it with one deliberately incomplete practice table and the real meadows table. Do not alter the published source to make a test pass.
5. Connect field evidence to Remote Sensing work carefully
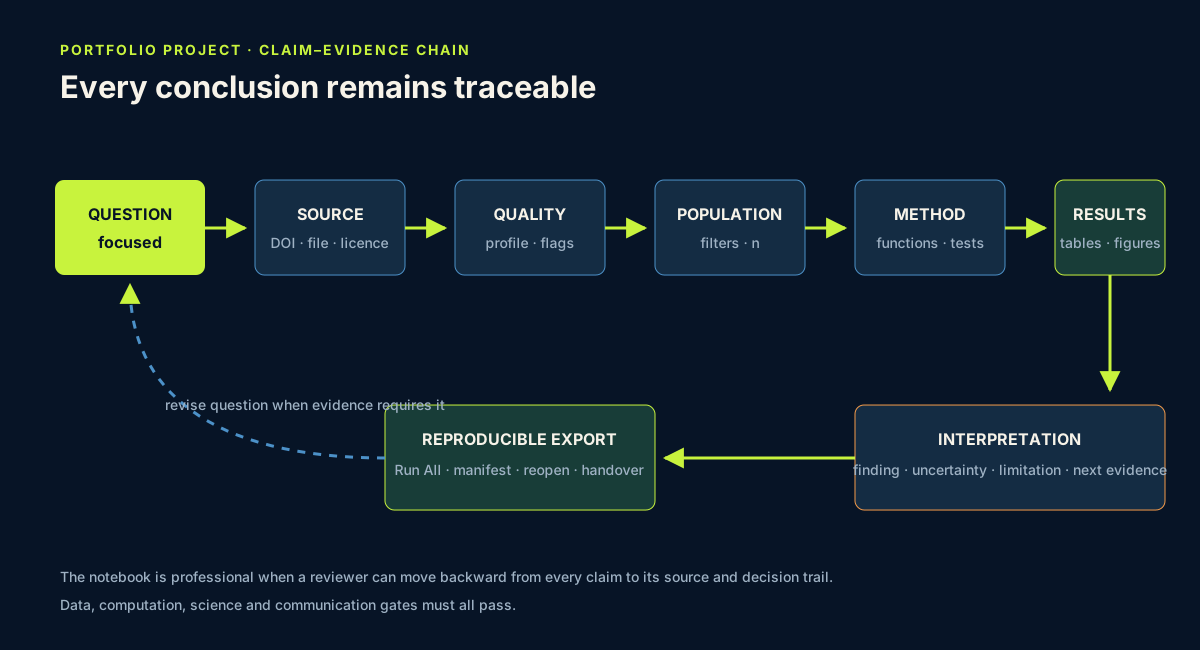
Field observations can support Earth Observation by providing ecological context, candidate response variables, calibration data or independent validation evidence. Those roles are not interchangeable.
Your Module 1 notebook should state:
- the field table contains plot-level observations, not satellite pixels;
- no plot coordinates are supplied in the CSV, so spatial matching cannot yet be performed;
- no predictive relationship with imagery has been tested;
- sampling dates, spatial support and measurement definitions would need to align with future EO inputs;
- any later model would need training and evaluation data separated appropriately.
This boundary is professionally important. A visually attractive ecological figure does not become a remote-sensing product until spatial, temporal and methodological links are established.
6. Produce tables and figures that can stand alone
Minimum results:
- one analysis-population table with inclusion counts;
- one data-quality or coverage table;
- one grouped descriptive table reporting
n, centre and spread; - one validated join or one mean-and-count reshape;
- two figures that answer different questions;
- a caption for every figure with source, population, statistic and limitations.
Export derived outputs to a new outputs folder. Never overwrite the raw CSV.
from pathlib import Path

output_dir = Path("outputs")
output_dir.mkdir(exist_ok=True)

richness_summary.to_csv(output_dir / "richness_summary_by_site.csv")
For figures, save before plt.show():
figure_path = output_dir / "richness_by_site.png"
plt.savefig(figure_path, dpi=300, bbox_inches="tight")
plt.show()
Use descriptive lowercase filenames, record what each file contains and confirm the exported file exists. A derived output is reproducible only when the notebook contains the instructions that created it.
Create an output manifest with filename, purpose, format, byte size and SHA-256 checksum. Reopen every CSV and image after export. Checksums identify the delivered bytes; reopening verifies usability; neither proves scientific validity.
7. Common mistakes and recovery
Writing the conclusion before defining the population
Recognition: the narrative says sites differ before filters, missingness and group counts are shown. Fix: finalise the methods and evidence first, then revise the summary.
Keeping only successful outputs
Recognition: quality decisions and failed assumptions disappear from the final notebook. Fix: remove temporary noise but retain concise evidence of checks, limitations and justified decisions.
Depending on hidden notebook state
Recognition: Run All fails even though individual cells worked earlier. Fix: restart the kernel, run in order, and move definitions before their first use.
Treating a large notebook as a complete notebook
Recognition: repeated code and long outputs obscure the argument. Fix: use functions, selected previews and concise tables; keep detailed audit outputs only where they support a decision.
Overclaiming from descriptive results
Recognition: observed group differences become causal statements or remote-sensing performance claims. Fix: state what was measured, what was compared and which evidence is absent.
Omitting citation or licence
Recognition: a reader cannot identify or reuse the source responsibly. Fix: cite Zenodo DOI 10.5281/zenodo.20083250, acknowledge creators and record CC BY 4.0.
8. Guided project review
Use this sequence before final submission:
- Restart the kernel and choose Run All.
- Confirm there are no unintended errors or manual inputs required midway.
- Compare loaded shape with
(120, 25). - Confirm source file and
SampleIDremain unchanged. - Check that every filter reports selected and excluded counts.
- Check that every group summary includes
n. - Validate join keys or show count matrices beside reshaped means.
- Verify figure labels, captions, contrast and readable text.
- Confirm every numerical claim appears in a visible output.
- Confirm limitations mention sampling structure, metadata and missingness where relevant.
- Export notebook, summary table and figures.
- Ask another reader to describe your question, result and limitation without assistance.
Give that reader the project folder in a fresh session. Ask them to locate the source, run the notebook from the beginning, reproduce one reported number, open every exported artifact and identify one unresolved scientific risk. Record what succeeded, what failed and what you changed. This is a handover test, not proofreading alone.
9. Independent scientific briefing
Write a 400–600 word briefing with four headings:
Question and evidence
State the focused question, source, analysis population and variables.
Result
Report two or three numerical findings with group counts and refer to a figure or table.
Interpretation
Explain what the pattern may mean ecologically using cautious language and distinguish observation from hypothesis.
Limitations and next step
Discuss sampling structure, missingness, metadata, absence of coordinates and the specific data needed to connect the field result to UAV or satellite observations.
10. Submission and final portfolio artifact
Submission package
- Notebook: final
Vegetation_Data_Explorer.ipynb, executed from top to bottom with visible outputs. - HTML or PDF export: a readable static version when your environment supports it.
- Data outputs: derived CSV summary and two figure files; do not submit a modified raw CSV as a result.
- Screenshot: title, research question and one final figure with caption.
- Written briefing: 400–600 words using the required structure.
- Reproducibility note: Python and library versions, source DOI, filename and run date.
Final self-assessment
Your project is portfolio ready when:
- every result can be traced to visible code and a documented source;
- the notebook runs from a clean kernel;
- quality and missingness decisions are explicit;
- functions and tests protect repeated logic;
- grouped results report denominators;
- joins and reshapes preserve entity meaning;
- figures are readable and captions are complete;
- claims remain within the evidence.
Professional portfolio decision
Classify the package as:
ready for Module 1 portfoliowhen all four gates, the clean run, output manifest, reopened artifacts and independent handover pass;conditionally readywhen the computation succeeds but a clearly stated metadata or communication issue remains;not readywhen source identity, execution, analysis population, entity integrity or claim traceability fails.
Map the evidence cautiously to the Academy graduate profiles:
- GIS/Remote Sensing Engineer foundation: immutable inputs, repeatable processing, tests and auditable outputs;
- Geospatial Data Analyst foundation: quality profiles, explicit populations, grouped summaries and defensible figures;
- Remote Sensing Researcher foundation: question–evidence reasoning, reproducibility, uncertainty boundaries and research handover.
These are foundational signals. Spatial data, imagery, coordinate systems, EO methods and validation evidence must be added by later modules before any graduate profile is credibly demonstrated.
Portfolio artifact
Portfolio Project 1 — Vegetation Data Explorer: reproducible Baltic coastal meadow analysis
This completed notebook demonstrates the computational mindset required of a Remote Sensing Scientist: not memorising commands, but designing a transparent path from environmental question to auditable evidence and responsible interpretation.
Optional species and community investigation
Use the Species Atlas to compare OP, LS, US and TG occurrence, then return to the plot table to distinguish richness, composition and cover. Treat the 120 quadrats as this study's reference observations, not as a regional distribution survey.