Module 3 · Chapter 1 · Prediction Framing Studio
Prediction, Inference and Explanation
Separate predictive claims from description, explanation and causal inference before selecting an algorithm. Practise with Scientific reasoning, Prediction.
Open this lesson in the Academy workspace1. Problem — decide what scientific job the model must do
Learning outcome
By the end of this lesson, you will be able to distinguish description, prediction, explanation and causal inference; recognise regression and classification problems; identify the target, predictors, observations, model and prediction domain in an Earth Observation study; and write a bounded Prediction Problem Statement before choosing an algorithm.
- Lesson type: Prediction Framing Studio
- Estimated time: 120–160 minutes
- Prerequisites: Module 1 scientific Python and evidence boundaries; Module 2 scale and spatial support, sampling, spatial autocorrelation, EO products and model-QA concepts
- Portfolio output:
PREDICTION_PROBLEM_STATEMENT.md
Why this matters
Many modelling failures begin before any code is written. A team has field observations, satellite layers and an algorithm in mind, but has not decided which scientific question the algorithm is supposed to answer. The same table can support a descriptive summary, a predictive model, an explanatory analysis or—in a much more demanding design—a causal claim. These are not interchangeable uses of data.
Remote-sensing models are particularly vulnerable to blurred claims. A vegetation index may predict biomass because it is associated with canopy structure. That success does not prove that changing the index would change biomass. A habitat classifier may reproduce labels in familiar sites. That result does not prove transfer to another coast, sensor or season.
Core lesson: define the scientific job before selecting the modelling machinery.
Mental model
Use three questions:
- What output must be produced? A value, class, probability, explanation or intervention effect?
- For which new cases? New plots, cells, sites, dates or regions?
- What evidence would make the claim credible? Description of sampled data, independent predictive evaluation, an explanatory model, or a causal design?
An accurate model can still answer the wrong question. A sophisticated algorithm cannot turn a predictive association into evidence of cause.
2. Scientific context — the Baltic coastal meadow team
The research group has completed a geospatial evidence pipeline. Field observations, UAV products and satellite measurements can now be represented with explicit spatial support and provenance. The next request sounds simple:
“Use Earth Observation to assess coastal-meadow condition.”
It is not yet a modelling problem. “Assess” could mean:
- describe conditions in sampled plots;
- predict vegetation height in unvisited cells;
- classify habitat condition for management screening;
- explain why condition differs among sites;
- estimate whether changing grazing management would improve condition.
Each interpretation requires different targets, evidence and validation. This lesson keeps the ecological story continuous while drawing a firm boundary: the Academy is now moving from geospatial processing to predictive judgement.
The published Baltic coastal plant-traits dataset remains useful scientific context, but it does not contain plot coordinates and its supplied metadata does not document every unit or code meaning needed for a predictive EO model. Do not invent those missing links. Chapter 1 uses an explicitly synthetic modelling-design pack so that the reasoning can be practised without misrepresenting the published record.
3. Concept — four kinds of scientific work
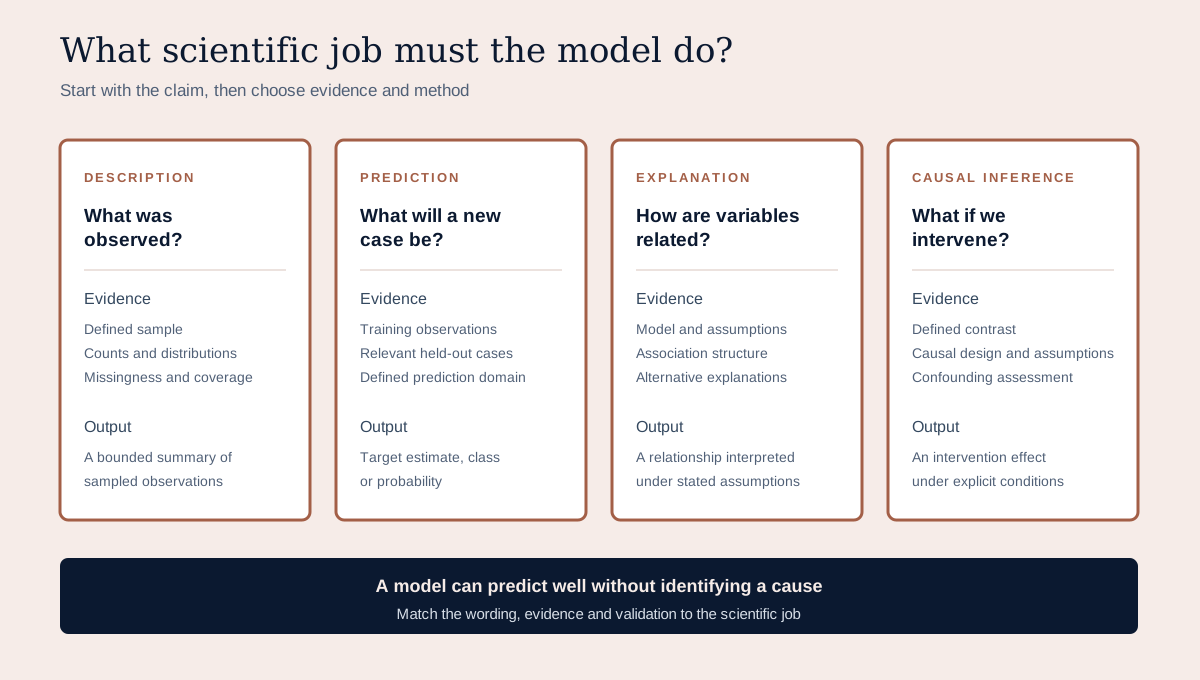
Description
Description organises observations that have already been made. A mean, distribution, map of sampled plots or missingness profile can be valuable without making a claim about unseen cases.
Example: “Among the sampled plots, recorded vegetation height was higher in group A than group B.”
The statement requires a defined analysis population and honest summary. It does not require a predictive model.
Prediction
Prediction estimates an unknown target for a case not used to fit the model. The target may become observable later, or it may be unmeasured at the prediction location.
Example: “Estimate vegetation height for withheld plots from EO predictors acquired within the defined time window.”
Prediction requires independent evaluation that resembles the intended use. Its central question is:
How well will this learned mapping perform for the new cases named in the claim?
Explanation
Explanation examines how variables relate under a stated model and assumptions. It may investigate a process, mechanism or theory. Explanatory usefulness and predictive performance can differ: a simplified scientific model may clarify a relationship but predict poorly, while a flexible predictive model may perform well without revealing a stable mechanism.
Example: “Characterise the association between canopy structure and observed height after accounting for declared site structure.”
The word association is important. An adjusted relationship is not automatically causal.
Causal inference
Causal inference asks what would happen under an intervention or exposure change. It needs a defensible causal contrast, assumptions about confounding and selection, and usually a study design beyond ordinary predictive validation.
Example: “Estimate how vegetation condition would change if grazing intensity were altered, compared with an otherwise relevant alternative.”
A random forest or XGBoost model does not create this evidence merely because management appears among its predictors. This module teaches prediction. It teaches causal caution so that predictive outputs are not overclaimed.
4. Build the vocabulary of a predictive problem
| Term | Meaning in this module | Coastal-meadow example |
|---|---|---|
| target | quantity or class the model must predict | field-measured vegetation height |
| predictor | information available to generate the prediction | EO reflectance, texture or elevation feature |
| observation | one case that links target and predictors at declared support | one accepted field plot and its matched EO evidence |
| model | a learned mapping from predictors to target | fitted regression or classification estimator |
| regression | prediction of a continuous numeric target | height, biomass or chlorophyll value |
| classification | prediction of a member of a defined class set | habitat condition category |
| prediction domain | places, times, sensors and conditions for intended use | represented Baltic meadow sites in a declared season and product specification |
The word observation is overloaded in science. A satellite observation is an acquisition; a field observation is a measurement; a modelling observation is one training case. Keep these meanings explicit. Lesson 3.4 will define the modelling row precisely.
Association is not a separate algorithm
Association means that variables vary together in the observed evidence. It can support prediction if the relationship persists in new cases. It can also arise through confounding, common spatial structure, shared acquisition conditions, leakage or chance.
Ask two different questions:
- Predictive: does the relationship persist when the target is hidden for appropriate new cases?
- Causal: would intervening on one variable change the target under a defensible causal design?
Only the first is answered by ordinary predictive validation.
Prediction domain belongs inside the claim
“The model predicts habitat condition” is incomplete. A professional statement names the evaluated domain:
The model estimates the declared condition class for 10 m cells in the represented coastal-meadow sites, using the specified Sentinel product and seasonal window. Transfer to unrepresented regions, years or sensors has not been established.
This wording is not timid. It makes the result useful because the reader can identify where it applies and where further evidence is needed.
5. Visual explanation — follow the claim–evidence chain
Read the diagram from left to right:
environmental need
        ↓
scientific job: describe, predict, explain or estimate an intervention
        ↓
target + prediction unit + domain
        ↓
observations and candidate predictors
        ↓
validation matched to the intended new case
        ↓
bounded claim + limitations
If the scientific job changes, later design decisions may also need to change. Predicting new plots within known sites is not the same as predicting a completely new site. Predicting next year is not the same as interpolating within the acquisition season. Chapter 3 will build the validation designs; Chapter 1 must name the claim they will test.
6. Worked example — classify the scientific statement before coding a model
Predict before running
Read the four statements. Predict which labels will print. Then ask whether the final statement could be answered by adding “grazing intensity” to an XGBoost feature table.
statements = {
    "Summarise height in sampled plots": "descriptive",
    "Estimate height for withheld plots": "predictive",
    "Model the height–texture association": "explanatory",
    "Estimate change caused by grazing": "causal",
}

allowed = {"descriptive", "predictive", "explanatory", "causal"}

for statement, claim_type in statements.items():
    if claim_type not in allowed:
        raise ValueError(f"Unknown claim type: {claim_type}")
    print(f"{claim_type:12} | {statement}")
Code walkthrough
statementsis a dictionary connecting each scientific sentence to its intended claim type.- The first entry remains within observed sampled plots, so it is descriptive.
- The second hides targets for new cases, so it is predictive.
- The third studies a relationship and is labelled explanatory; it does not use causal language.
- The fourth asks about an intervention and is causal.
allowedrecords the controlled vocabulary as a set because membership matters and order does not.- The loop reads each statement–type pair.
- The condition prevents an undocumented label from silently entering the review.
raise ValueErrorstops execution with the invalid label.- The final line prints a compact classification table.
The code checks terminology; it does not decide whether the classification is scientifically correct. That judgement still belongs to the learner and reviewer.
Diagnostic check
Add this statement:
statements["Map measured height at sampled plots"] = "descriptive"
Does “map” make the task predictive? No. A map can display already observed measurements. Prediction begins when a target is estimated for a case whose target was not supplied to the model.
7. Model clinic — an excellent number attached to the wrong claim
Claim: “NDVI explains 92% of biomass and therefore increased greenness causes increased biomass.”
Diagnose it in four parts:
| Question | Diagnosis |
|---|---|
| problem | predictive or associational evidence has been written as a causal conclusion |
| evidence to request | exact target, sample, validation, domain, temporal ordering, causal assumptions and alternative explanations |
| consequence | a management decision may be justified by a mechanism the study did not test |
| fix | rewrite the predictive claim and design a separate causal investigation if an intervention effect is required |
Even the phrase “explains 92%” is ambiguous. It could refer informally to an in-sample R², an independent score or variance under a particular model. Record the metric and evaluation design instead of using “explain” as a synonym for “predict.”
8. Common mistakes and recovery
Choosing the algorithm before the question
- Why it happens: tools are concrete, while prediction claims feel abstract.
- How to detect it: the project begins with “use XGBoost” but cannot name one target and new-case domain.
- How to prevent it: approve the Prediction Problem Statement before model selection.
- Consequence: the workflow may optimise a quantity that does not answer the environmental need.
Treating prediction as explanation
- Why it happens: flexible models reveal strong patterns and software calls inputs “features.”
- How to detect it: predictive performance is followed by mechanism language without a separate design.
- How to prevent it: use predictive verbs—estimate, classify, rank—and state what causal evidence is absent.
- Consequence: scientific interpretation outruns the evaluation.
Treating classification labels as natural truth
- Why it happens: integer codes look definitive after encoding.
- How to detect it: label definitions, observation protocol and ambiguous cases are missing.
- How to prevent it: document who or what assigned each class, at what support and according to which rule.
- Consequence: a model can reproduce an undocumented labelling process rather than a meaningful ecological state.
Defining “new data” too vaguely
- Why it happens: held-out rows are described as independent without checking geography or time.
- How to detect it: the claim does not distinguish a new plot, site, year, region or sensor.
- How to prevent it: write the intended prediction domain and transfer scenario as a sentence.
- Consequence: later validation may be easy but irrelevant.
Calling the prediction map truth
- Why it happens: complete spatial coverage looks more authoritative than sparse reference observations.
- How to detect it: captions use “observed” for modelled cells or omit unsupported areas.
- How to prevent it: label the output as a prediction and later pair it with uncertainty and applicability evidence.
- Consequence: visual completeness hides inferential limits.
9. Guided practice — classify the supplied statement cards
Download scientific_statement_cards.csv from the lesson resources.
- Hide the
review_labelandreview_reasoncolumns. - Classify every statement as descriptive, predictive, explanatory or causal.
- Underline the phrase that determines the class.
- For each predictive statement, name the target and the new case.
- For each causal statement, name the intervention and comparison implied by the wording.
- Reveal the review columns and investigate disagreements rather than simply replacing your answer.
- Rewrite two ambiguous cards so their claim type becomes explicit.
Create statement_classification_review.csv with your classification, confidence (high, medium, low) and rationale. Low confidence is useful evidence: it identifies wording that needs revision.
10. Independent challenge — write the Prediction Problem Statement
Choose one pathway:
Regression pathway
Estimate a continuous ecological target such as vegetation height for declared new prediction units.
Classification pathway
Predict a defined ecological-condition or habitat class for declared new prediction units.
Write PREDICTION_PROBLEM_STATEMENT.md with these headings:
- Environmental need — who needs the output and for which bounded use?
- Scientific job — descriptive, predictive, explanatory or causal?
- Target — provisional name and type; Lesson 3.2 will formalise it.
- Prediction unit — provisional plot, cell, polygon or object.
- New-case claim — within-site, new-site, future-time or other defined transfer.
- Candidate evidence — field target source and EO predictor families.
- Prediction domain — represented places, times, sensors and conditions.
- Supported statement — one sentence the finished workflow should be able to defend.
- Non-claims — at least three statements the project will not support.
- Decision to continue — proceed, revise or stop, with the missing evidence named.
Do not select XGBoost yet. The purpose is to make algorithm choice answerable later.
11. Scientific interpretation
Scientific prediction is not lesser than explanation. It is a different intellectual task with its own demanding standard: the model must perform for genuinely relevant new cases, under conditions represented by evidence, with failure and uncertainty made visible.
The correct end point of this lesson is not “I know four definitions.” It is:
I can recognise the claim an environmental project needs, state the case that receives a prediction, and prevent a predictive result from becoming an unsupported causal story.
12. Submission
Submit:
PREDICTION_PROBLEM_STATEMENT.md;statement_classification_review.csv;- one screenshot showing an ambiguous statement before and after revision;
- a 180–260 word written answer explaining why useful prediction does not establish ecological causality.
Portfolio artifact
Artifact 3.1 — Prediction Problem Statement
This document becomes the opening contract for the Environmental Monitoring Project. Lessons 3.2–3.4 will add the target specification, predictor hypotheses and pre-registered experiment plan. Preserve it; do not rewrite the project history invisibly.
13. Reflection
Answer in private notes:
- Which word most often turns a predictive statement into a causal one?
- Can a descriptive map contain important scientific knowledge without predicting anything?
- What new case does your current project intend to predict?
- Which part of your prediction domain is least well represented?
- What evidence would be required before making an intervention claim?
14. Core references and advanced reading
- Shmueli (2010), To Explain or to Predict?
- scikit-learn glossary: feature, sample and target
- Roberts et al. (2017), structured cross-validation
- Hernán and Robins, Causal Inference: What If
Tested software versions
Python 3.12.13, NumPy 2.4.2, pandas 2.2.3, scikit-learn 1.9.0 and XGBoost 3.3.0. This lesson uses only core Python in its worked example; later versions are recorded now so the continuing project has one explicit environment baseline.