Module 3 · Capstone · Independent Module Capstone
Environmental Monitoring Project
Design, validate and hand over an independent predictive Earth Observation workflow as a reviewable scientific evidence package.
Open this lesson in the Academy workspace1. Problem — build a monitoring system whose predictions can be defended
Learning outcome
By the end of this capstone, you will be able to independently define, implement, evaluate and communicate a complete predictive Earth Observation workflow; keep target meaning, training evidence, model selection and protected assessment separate; compare a baseline, a tree ensemble and XGBoost; match spatial and temporal validation to the intended transfer; diagnose structured failure; quantify and test uncertainty; withhold unsupported predictions; generate quality-controlled raster evidence; assign a bounded role to Google Earth Engine; and hand over a reproducible Environmental Monitoring Project whose claims can be reviewed rather than merely admired.
- Lesson type: Independent Module Capstone
- Estimated time: 40–60 hours over four to six weeks
- Prerequisites: All thirty Module 3 lessons and the Module 2 geospatial evidence pipeline
- Portfolio output:
Environmental_Monitoring_Project/ - Completion standard: every automatic revision gate passes and every scientific limitation remains visible in the release
Why this matters
Professional modelling is judged at its interfaces. A correct XGBoost call cannot repair an ambiguous target. A high score cannot repair proximity leakage. A narrow interval cannot make an extrapolated cell trustworthy. A polished map cannot prove ecological change. An automated annual run cannot preserve validity when the sensor, phenology or prediction domain changes.
This capstone tests whether you can hold the entire evidence chain together. You are not following a recipe. You are making decisions, recording why they are defensible, and creating evidence that another qualified person can challenge. The objective is not the highest metric. It is the strongest bounded predictive claim supported by the available observations.
Core lesson: the project succeeds when the decision, prediction contract, protected evidence, limitations and operational controls agree. A model result without its validation design is incomplete.
Scientific context
You have joined a coastal-environment organisation that must prioritise monitoring effort across Baltic coastal meadows. Field visits are limited. Earth Observation can help screen places for follow-up, but the organisation will not accept a map whose scientific support is unclear.
Choose one approved target with documented meaning. A regression pathway might predict a measured vegetation property. A classification pathway might predict a documented ecological-condition class. You may use an instructor-approved real dataset, a properly licensed public dataset, or the Academy synthetic pack for workflow demonstration.
If you use the synthetic pack, label the result training demonstration only. It cannot support a real Baltic environmental decision, accuracy claim or monitoring deployment. If a published field variable lacks documented units, protocol or code meaning, do not infer them. Choose a documented target or restrict the project to a methodological demonstration.
2. Mental model — one claim, fifteen evidence phases
Visual explanation
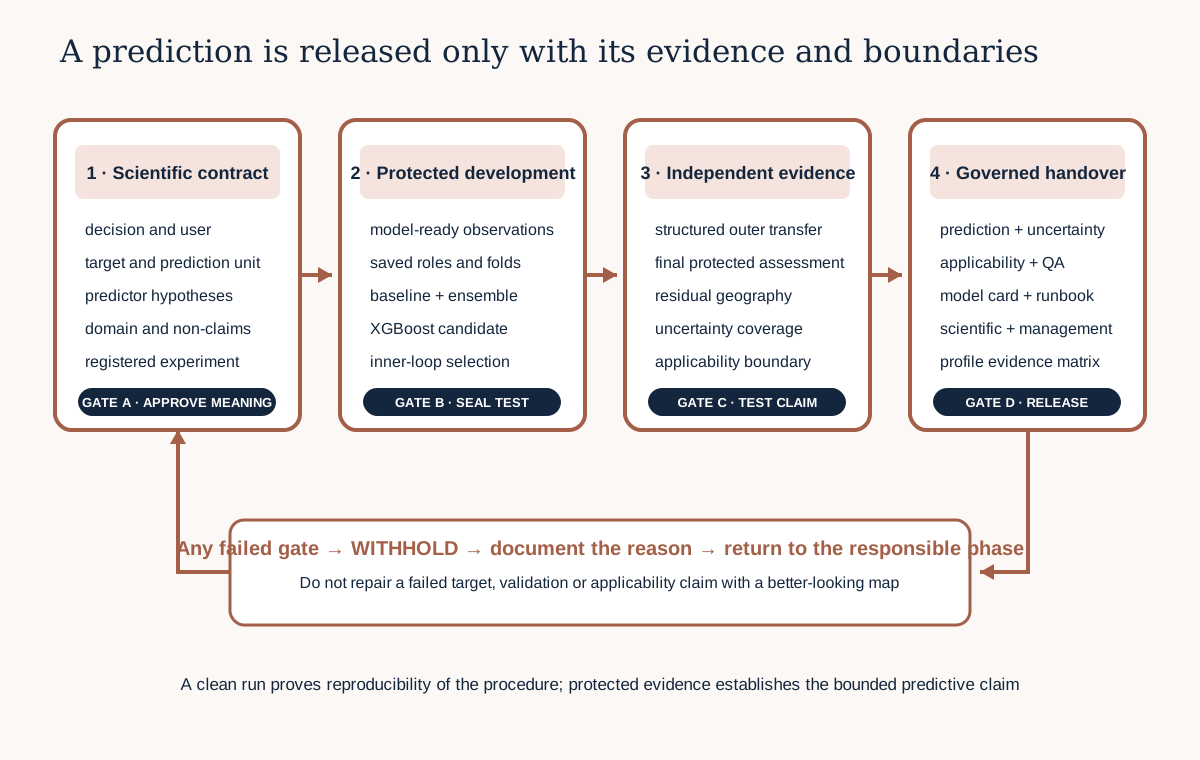
The capstone has fifteen phases. They form one dependency chain:
decision → target → predictors → registered experiment → training table
       → baseline → candidate models → controlled tuning
       → protected evaluation → diagnosis → interpretation
       → uncertainty + applicability → spatial prediction
       → cloud component → monitored handover
You may return to an earlier phase when evidence fails. You may not quietly rewrite the prediction claim after seeing the final test. Record amendments with date, reason and consequences. If the scientific question changes materially, create a new experiment version and protect new assessment evidence.
3. Phase 1 — define the decision before the algorithm
Write a decision statement answering:
- Who will use the output?
- What decision or follow-up action could it inform?
- What receives one prediction?
- Which place, season, sensor and management context are in scope?
- What error would cause the most harmful decision?
- What will the project explicitly not claim?
“Map meadow quality” is insufficient. A bounded statement is stronger:
Screen 10 m cells within the reviewed study boundary for field follow-up during the represented growing-season window, using a model evaluated for transfer to held-out meadow sites. The output is not a direct observation, habitat certification, causal management estimate or proof of ecological change.
This wording already constrains target, prediction unit, validation and communication. If the organisation needs new-site predictions, a validation design that mixes neighbouring plots cannot answer its question.
4. Phase 2 — write the prediction and target contracts
Complete PREDICTION_PROBLEM.md and TARGET_SPECIFICATION.md. Record:
- target name, type and units;
- observation protocol and authority;
- continuous range, class definitions, zeros and detection limits;
- field spatial support and temporal support;
- output prediction unit;
- intended spatial and temporal domains;
- available predictors at prediction time;
- intended use, success criterion and unsupported uses.
Ask what exactly receives one prediction? A field plot, polygon, UAV object and raster cell are different units. Extracting raster values at a plot centroid does not make plot and cell support equivalent. State how the mismatch is handled and what information is lost.
Stop if target units, protocol or class meaning are guessed. Presence of a value in a table is not evidence of how or when it was sampled.
5. Phase 3 — preregister the experiment and protect the final test
Before fitting, freeze MODEL_EXPERIMENT_PLAN.md with:
- primary target and success criterion;
- naive baseline and scientific comparator;
- primary metric and supporting metrics;
- candidate Random Forest or comparable ensemble;
- XGBoost candidate;
- feature set and transformations;
- outer validation claim;
- inner tuning design;
- final protected evidence and its custodian;
- uncertainty method and nominal coverage where relevant;
- applicability rule;
- exclusions and amendment procedure.
The final test is not a convenient validation set. It is evidence reserved for the registered model-selection procedure. Do not use it to choose features, thresholds, transformations, hyperparameters, interval methods or narrative emphasis.
If you accidentally inspect the final target or use test performance to revise the model, record the breach. The original test can no longer provide independent evidence for that revised procedure. Obtain new protected evidence or narrow the status to exploratory.
6. Phase 4 — build the modelling dataset as scientific evidence
Create training_data.parquet, data_dictionary.csv, predictor_hypotheses.csv and a saved fold registry. One row must represent one declared modelling observation. Preserve:
- stable observation ID;
- target and target-quality status;
- site, group, block and acquisition date;
- spatial and temporal support;
- predictor source, unit, transform and version;
- development, calibration or protected-assessment role;
- exclusion flag and reason;
- fold assignment generated before modelling.
Audit duplicate targets, repeated acquisitions, neighbouring samples, derived products and target-derived variables. A column can leak the answer without being named after the target. Management labels recorded after the outcome, field summaries computed from the same response, or global preprocessing fitted before splitting may all cross the evidence boundary.
Every predictor needs a scientific hypothesis and an operational availability check. “Correlated with the target” is not enough. Explain the measurement pathway, expected limitation, support, acquisition timing and whether the same definition will exist when predictions are generated.
7. Phase 5 — establish the baseline before rewarding complexity
Use the same outer folds for every model comparison. For regression, fit a training-fold mean or median baseline and a justified simple model. For classification, use a frequency or majority baseline and a transparent simple classifier. Report the error consequence of the baseline, not only its score.
A candidate is useful only if it improves relevant evidence. A small average improvement with unstable site-level failure may not justify a more complex operational system. A simple model may be preferable when data are scarce, interpretation is critical or the flexible model's apparent advantage disappears under spatial separation.
Create baseline_report.md containing fold-level predictions, metrics in target units, confidence or spread across folds and a decision about whether the modelling task contains learnable signal beyond the declared comparator.
8. Phase 6 — compare candidate models under one evidence contract
Require three levels:
- the frozen baseline;
- a Random Forest or comparable tree ensemble;
- XGBoost.
Use reproducible pipelines. Keep feature ordering, preprocessing, missingness rules, random seeds, package versions and model metadata explicit. Fit transformations only within the appropriate training partition. Store parameter dictionaries with a reason for each material choice.
Do not tune yet. First compare untuned candidates under the same development evidence. This establishes whether the algorithm family adds useful signal and reveals failures before search makes the workflow harder to diagnose.
9. Worked example — a release gate must fail closed
Predict before running
The model beats the baseline and every file exists, but the applicability analysis has not passed. Will this code release the project? What exact message should a reviewer see?
release_gates = {
    "prediction contract": True,
    "training-data integrity": True,
    "protected evaluation": True,
    "uncertainty and applicability": False,
    "reproducible handover": True,
}

blocked = [name for name, passed in release_gates.items() if not passed]
status = "RELEASE" if not blocked else "WITHHOLD"
print(status, blocked)
Code walkthrough
release_gatesnames separate scientific and operational responsibilities.- Each Boolean represents a reviewed evidence record, not the opinion of the code.
- The list comprehension preserves every failed gate rather than returning only the first.
statuscan becomeRELEASEonly when the blocked list is empty.- The printout makes both the decision and its reason visible.
- Here the result is
WITHHOLDbecause uncertainty and applicability are incomplete. - Good software can enforce a declared rule; it cannot decide whether the underlying scientific review was competent.
Diagnostic check
Run the example once. Then change protected evaluation to False. Confirm that the list reports both failures. Finally, set every value to True and explain why the output proves gate completion but does not by itself prove ecological validity.
10. Phase 7 — tune inside development evidence only
Build an informed bounded search. Connect each hyperparameter range to learning dynamics, regularisation, sampling or tree complexity. Use nested or otherwise protected selection when the final performance claim includes the selection procedure.
The inner loop selects hyperparameters. The outer loop estimates the generalisation of that complete selection process. The protected final test evaluates the frozen procedure once. Early stopping needs a development-only evaluation set; its best iteration is a selected parameter and must not be chosen on protected assessment evidence.
Save the search space, fold assignments, score rule, candidate results and selected configuration. Do not report only the winning row. A tuning record must show what was tried and why the evidence boundary remained intact.
11. Phase 8 — validate the real-world transfer claim
Compare a random split with the structured design as a diagnostic, not as competing publicity scores. Then use the design that represents the decision:
- grouped or leave-location-out validation for new sites;
- spatial blocks or buffered holdouts for separation across geography;
- train-past/predict-future or leave-year-out for temporal transfer;
- combined spatial and temporal separation for a new-place/new-time claim.
Report fold composition and demonstrate that groups, duplicate observations, close derivatives and forbidden dates do not cross boundaries. A single average hides instability. Provide fold-level metrics and explain the hardest fold.
If random performance is much better than spatial performance, do not average them. The gap is evidence that proximity or site structure helps the easier task. Use the structured result for the structured claim.
12. Phase 9 — evaluate performance and structured failure
For regression, report R², RMSE, MAE and bias, including units where defined. Show observed-versus-predicted, residual-versus-fitted, residual distribution and fold-level results.
For classification, report the confusion matrix, precision, recall, F1 and balanced accuracy. Where probabilities support decisions, evaluate Brier score or another proper score, reliability and threshold consequences. Strong imbalance makes raw accuracy especially uninformative. Select a threshold from the decision cost and protected development evidence, not from habit.
Map residuals and analyse error by site, habitat, management group, acquisition condition and relevant environmental gradients. Ask whether acceptable averages conceal a region or subgroup for which the model should be withheld.
Create MODEL_DIAGNOSTIC_REPORT.md with the error pattern, likely mechanism, consequence and proposed response. “More data” is not a sufficient response unless you state what evidence is missing and how sampling will repair the failure.
13. Phase 10 — interpret without converting prediction into causality
Use permutation importance plus one additional method such as SHAP or partial dependence. Compare results across outer folds and correlated feature groups. Report stability, not only a ranked chart.
Feature importance indicates how the fitted prediction system used information under the available evidence and method. It does not establish an ecological mechanism. SHAP values allocate a prediction difference relative to a reference under modelling assumptions; they are not intervention effects.
Write three columns in INTERPRETATION_REPORT.md:
| Supported predictive statement | Evidence | Statement not supported |
|---|---|---|
| Feature group contributed reproducible predictive information under held-out sites | stable permutation relevance across outer folds | changing that feature would cause the target to change |
This distinction is a core scientific deliverable, not a disclaimer added at the end.
14. Phase 11 — test uncertainty and domain of applicability
For regression, generate a point prediction and a justified interval using quantile or conformal methods. Report empirical coverage and interval width overall and by relevant groups. For classification, evaluate probability quality and decision uncertainty. In both pathways, keep extrapolation risk separate from model uncertainty.
Build a Domain of Applicability analysis using predictor ranges, a multivariate distance or nearest training analogue, with a predeclared review/withhold rule. Test sensitivity to scaling and correlated predictors. A visually complete map must not imply equal support everywhere.
The evidence package must contain three distinct layers:
prediction.tif— what the frozen model predicts;uncertainty.tifor probability-quality equivalent — how prediction dispersion or probability evidence behaves;applicability.tif— where predictor conditions are represented, require review or fall outside support.
15. Phase 12 — generate and inspect spatial predictions
Validate the frozen feature schema before inference: name, order, unit, transform, spatial support, temporal support, source version and dtype. Reject training-serving skew. Use a valid prediction mask, preserve NoData, run in chunks where needed and confirm that chunk size does not change values.
Reopen every output and inspect:
- CRS, transform, width, height, bounds and resolution;
- output dtype and NoData encoding;
- valid-data footprint;
- numerical or class range;
- interval ordering and probability range;
- one-pixel alignment and seam artifacts;
- agreement between applicability state and released prediction;
- accessible legend, units and non-claim.
A correct array shape does not prove correct geography. Perform pixel-to-coordinate spot checks and compare the full grid signature with the declared destination.
16. Phase 13 — give Earth Engine one necessary role
Use Google Earth Engine only where it adds a genuine capability: building a versioned time-series predictor stack, obtaining large-area environmental context, running a supported server-side model, or producing repeatable annual composites. Record collection IDs, filters, scale, mask, projection, sampling or export settings and task identifiers.
Do not claim that XGBoost runs natively in Earth Engine. Earth Engine provides supported classifiers and regression modes, but local XGBoost, custom nested validation, SHAP and specialised uncertainty normally remain in the controlled Python workflow. In a hybrid design, validate schema and grid at the export/import boundary.
The cloud component must simplify a real requirement. It must not duplicate local processing merely to list another technology in the portfolio.
17. Phase 14 — design operational monitoring without claiming observed change
Create MONITORING_RUNBOOK.md for the next scheduled run. Define:
- input eligibility and QA;
- model and feature-schema identity;
- covariate-shift indicators;
- applicability and uncertainty review thresholds;
- comparison with an independent reference product;
- owner and response for release, review, retrain and retire states;
- protected labels for future model replacement assessment.
A difference between two prediction maps is modelled difference, not automatically observed ecological change. Before interpreting change, verify comparable inputs, fixed target meaning, consistent support, stable model validity and new field evidence. Concept drift requires new paired target evidence; predictor drift alone cannot establish it.
18. Phase 15 — communicate and hand over three versions of the truth
Produce three connected documents:
SCIENTIFIC_SUMMARY.mdfor methods, evidence, uncertainty, limitations and supported claims;MODEL_CARD.mdfor target, schema, data, validation, metrics, applicability, intended and unsupported uses, versions and governance;MANAGEMENT_BRIEF.mdfor the decision, priority areas, uncertainty, withheld regions, required follow-up and what the map does not show.
The documents have different audiences but may not contradict one another. If the management brief says “measured decline” while the scientific summary says “predicted difference”, the release fails.
Create an accessible primary map and equivalent table/text description. Do not rely on colour alone. Include units, time, prediction unit, validity status and withheld areas. Remove sensitive coordinates from public files and record the authorised review path.
19. Common mistakes — diagnose, recover, prevent
Choosing the algorithm before the target
Why it happens: software feels concrete while target protocol feels slow. Recognise it: the project can name XGBoost parameters but not one prediction unit. Fix it: freeze the decision and target specifications first. Consequence: technically polished output with undefined scientific meaning.
Training-serving skew
Why it happens: development uses convenient predictors not reproducible during monitoring. Recognise it: feature provenance differs between training and inference. Fix it: enforce the ordered feature schema and prediction-time availability register. Consequence: silent model failure despite a valid file format.
Tuning on the test set
Why it happens: the learner wants one more improvement after seeing the score. Recognise it: model decisions cite protected-test results. Fix it: record the breach, obtain fresh assessment evidence or label the result exploratory. Consequence: optimistic performance with no independent confirmation.
Random validation for a new-site claim
Why it happens: random splits are familiar and often produce reassuring numbers. Recognise it: the same site or neighbourhood appears in training and assessment. Fix it: use grouped, blocked or buffered evaluation matched to the destination. Consequence: proximity leakage misrepresented as transfer skill.
Optimising one metric
Why it happens: leaderboards reward a single number. Recognise it: no fold variability, bias, subgroup failure or threshold consequence is reported. Fix it: use a metric panel and diagnostic maps. Consequence: a model can look strong while failing the decision-critical case.
Interpreting importance causally
Why it happens: explanation plots use persuasive visual language. Recognise it: “drives” or “causes” appears without causal design. Fix it: restate importance as predictive contribution under the fitted model and inspect stability. Consequence: invalid ecological mechanism claims.
Publishing outside the training domain
Why it happens: empty map areas appear unfinished. Recognise it: no applicability state accompanies the prediction. Fix it: flag or withhold unsupported cells. Consequence: the least supported areas may look as authoritative as the best supported ones.
Treating automation as validity
Why it happens: a clean run is satisfying. Recognise it: CI success is cited as scientific approval. Fix it: separate structural, numerical, spatial, scientific and operational gates. Consequence: reproducibly wrong results can be published quickly.
20. Guided practice — four review gates
Gate A — proposal review
Submit the decision statement, Prediction Problem Statement, target specification, predictor hypotheses and experiment plan. Do not fit a final model until the target, unit, support, intended domain and protected evidence are acceptable.
Gate B — development review
Submit the model-ready table contract, data dictionary, saved folds, baseline report, untuned candidate comparison and tuning protocol. Demonstrate that test evidence has not influenced development.
Gate C — evidence review
Submit fold-level metrics, residual and subgroup diagnostics, interpretation stability, uncertainty diagnostics and applicability analysis. State what failed and how the claim changed.
Gate D — release defence
Run the project in a clean environment. Reopen rasters. Verify manifests. Present the scientific summary, model card, management brief and monitoring runbook. A reviewer chooses three files at random and asks you to trace each one back to source evidence.
21. Independent challenge — defend the project under change
Prepare a ten-minute defence for one scenario selected after submission:
- the organisation wants predictions for a new coastal region;
- the next season uses a changed satellite product version;
- the rare class prevalence doubles;
- field sampling moves two weeks later;
- the Earth Engine composite has fewer valid observations;
- the model's average score is stable but one meadow site deteriorates.
Explain which artifacts remain valid, which assumptions fail, what new evidence is required, what must be withheld and whether to reuse, review, retrain or retire the model. Do not solve the scenario by promising a more complex algorithm.
22. Scientific interpretation
Your conclusion must answer the registered question at the tested destination. State whether the candidate beat the baseline, how stable performance was, where errors concentrated, how interval or probability evidence behaved, which cells were unsupported, and what action is proportionate.
A strong result may be: “The frozen model improved MAE relative to the training-fold baseline under held-out-site evaluation within represented 2024–2026 conditions. Predictions outside the accepted analogue threshold were withheld. The map can prioritise field review but cannot certify habitat status, estimate a management effect or establish ecological change.”
A result that fails the release gate can still be a strong scientific capstone if the diagnosis is rigorous. “Withhold” is a professional decision when evidence does not support deployment.
23. Submission and portfolio artifact
Submission
Submit a versioned repository containing:
- project README, citation, environment and run instructions;
- immutable source/data access record and data dictionary;
- prediction, target, predictor and experiment contracts;
- saved roles and fold assignments;
- baseline, ensemble and XGBoost development evidence;
- tuning record and protected evaluation;
- metrics, residual, subgroup and interpretation diagnostics;
- prediction, uncertainty and applicability rasters with QA;
- bounded Earth Engine component record;
- tests, model file, schema, manifests and checksums;
- scientific summary, model card, management brief and monitoring runbook;
- completed graduate-profile evidence matrix.
Use private notes for your reasoning. Upload assessed files in the submission area. Use the private learner–instructor conversation for revision questions. Do not place restricted locations or confidential data in shared discussion.
Portfolio artifact
The Environmental Monitoring Project is credible only when each claimed capability points to evidence:
- GIS / Remote Sensing Engineer: frozen raster schema, chunk-invariant inference, CRS/grid/NoData QA, interface contracts, automated release tests and reproducible handover;
- Geospatial Data Analyst: target and metric reasoning, baseline comparison, structured evaluation, residual geography, accessible map/table and decision-oriented brief;
- Remote Sensing Researcher: predictor hypotheses, support and transfer logic, protected evidence, uncertainty, applicability, limitations and a reproducible scientific argument.
Do not claim all three profiles because the repository lists their technologies. Complete GRADUATE_PROFILE_EVIDENCE_MATRIX.md with a file, figure, test or recorded decision for every claimed capability.
24. Reflection
- Which assumption connects the target measurement to the prediction unit?
- Which evidence was genuinely protected from model selection?
- Why did the structured and random evaluations differ?
- Where does the model fail, and what mechanism might explain the pattern?
- What does the interpretation method reveal, and what causal statement remains unsupported?
- Where were predictions withheld because of applicability or uncertainty?
- What would have to change before the project could support a real management decision?
- Which single artifact best demonstrates each graduate profile?
25. Core references
- scikit-learn developers, Nested versus non-nested cross-validation
- XGBoost developers, Prediction and early-stopping behaviour in XGBoost 3.3
- Google Earth Engine, Supervised classification and independent validation
- Valavi et al. (2019), Spatially and environmentally separated cross-validation
- Mitchell et al. (2019), Model Cards for Model Reporting
26. Advanced reading
- The Turing Way, Reproducible research
- NIST, AI Risk Management Framework
- scikit-learn, Probability calibration
- Google Earth Engine, Machine learning in Earth Engine
27. Tested software versions
The Academy examples and checks were reviewed with Python 3.12.13, NumPy 2.4.2, pandas 2.2.3, scikit-learn 1.9.0 and XGBoost 3.3.0. Earth Engine capabilities are linked to the current official guides; classifier output modes vary by algorithm and must be checked before design. Your submission must record the versions actually used. The Academy pack is synthetic training evidence and is not a validated environmental monitoring dataset.